Colored Network Diagrams (Part 2)
Executive Summary
This blog post is the continuation of the blog post Colored Network Diagrams (Part 1). In this blog post, I describe some improvements and enhanced capabilities of the scripts that have been presented in Part 1 already. The new set of scripts can now additionally color network graphs (PERT charts) according to:
- … remaining durations
- … remaining work
- … criticality based on remaining duration
Before reading this blog post, you need to read the blog post Colored Network Diagrams (Part 1) first to fully understand the context.
Preconditions
In order to use the approach described here, you should:
- … have access to a Linux machine or account
- … have a MySQL or MariaDB database server set up, running, and have access to it
- … have the package graphviz [2] installed
- … have some basic knowledge of how to operate in a Linux environment and some basic understanding of shell scripts
Description and Usage
In the previous blog post Colored Network Diagrams (Part 1) we looked at a method on how to create colored network graphs (PERT charts) based on the duration, the work, the slack, and the criticality of the individual tasks. We also looked at how a network graph looks like when some of the tasks have already been completed (tasks in green color). We will now enhance the script sets in order to process remaining duration and remaining work. In addition, this information shall also be displayed for each task. For this, the scripts create_project_db.sql, msp2mysql.sh, and mysql2dot.sh require modifications so that they can process the additional information. I decided to name the new scripts with a “-v2” suffix so that they can be distinguished from the ones in the previous blog post.
Let us first look at the script create_project_db-v2.sql which sets up the database [1]. Compared to the previous version, it now sets up some new fields which have been highlighted in red color below. For the sake of readability, only parts of the script have been displayed here.
...
task_duration INT UNSIGNED DEFAULT 0,\
task_work INT UNSIGNED DEFAULT 0,\
free_slack INT DEFAULT 0,\
total_slack INT DEFAULT 0,\
finish_slack INT DEFAULT 0,\
rem_duration INT UNSIGNED DEFAULT 0,\
rem_work INT UNSIGNED DEFAULT 0,\
`%_complete`
In addition to the fields rem_duration and rem_work, we also prepare the database for 3 out of the 4 slack types that tasks have (free_slack, total_slack, finish_slack), in order to be able to execute some experiments in future releases. Furthermore, we can now capture the link_lag between two linked tasks; this information will not be used now, but in a future version of the script set.
Step 1: Parsing the Project Plan
The script msp2mysql-v2.sh parses the Microsoft® Project plan in XML format. It contains a finite-state machine (see graph below), and the transitions between the states are XML tags (opening ones and closing ones).
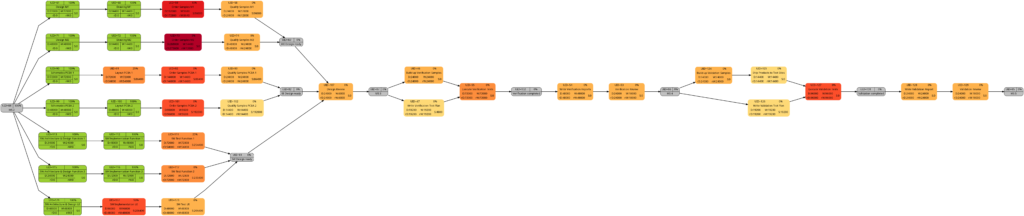
Step 2: Generating a Graph
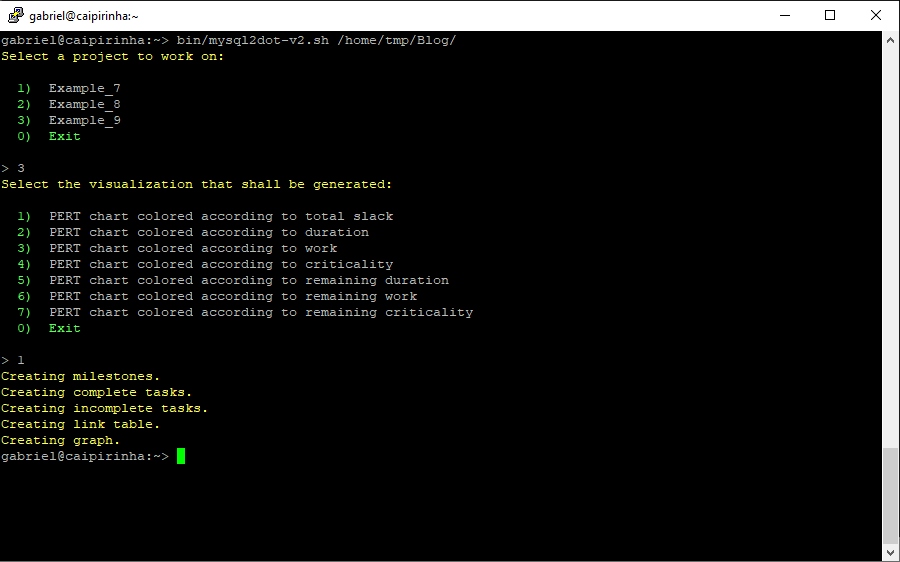
Now we can extract meaningful data from the database and transform this into a colored network graph; this is done with the bash script mysql2dot-v2.sh. mysql2dot-v2.sh can create colored network graphs according to:
- … the task duration
- … the work allocated to a task
- … the total slack of a task
- … the criticality of a task
- … the remaining task duration
- … the remaining work allocated to a task
- … the remaining criticality of a task
mysql2dot-v2.sh relies on a working installation of the graphviz package, and in fact, it is graphviz and its collection of tools that create the graph, while mysql2dot-v2.sh creates a script for graphviz in the dot language. Let us look close to some examples:
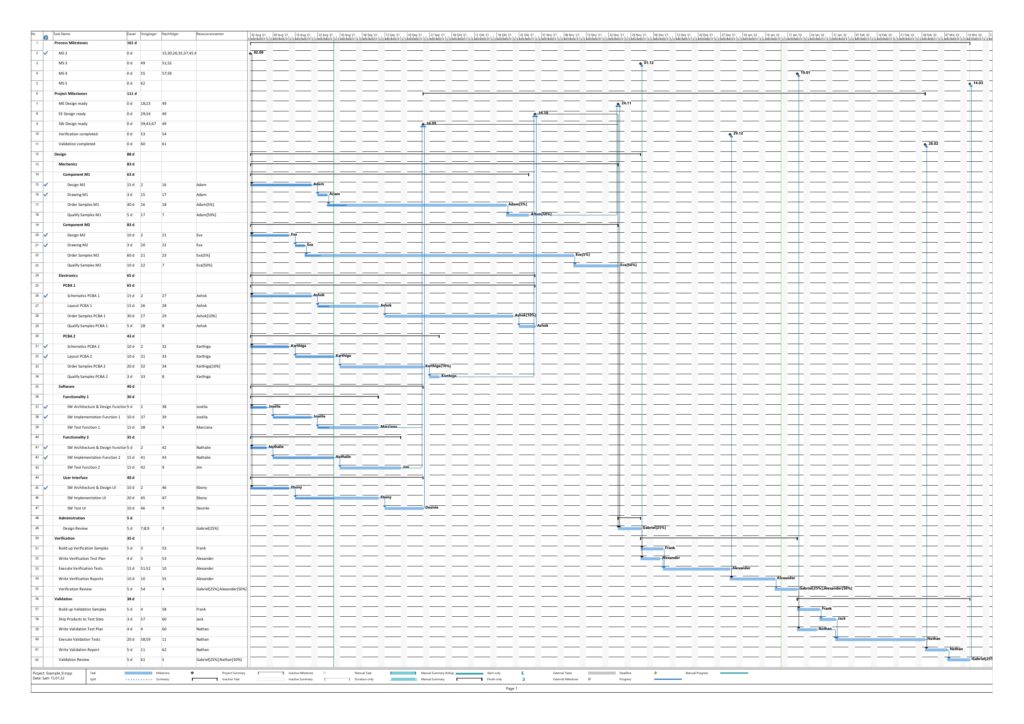
Example 8: A real-world example
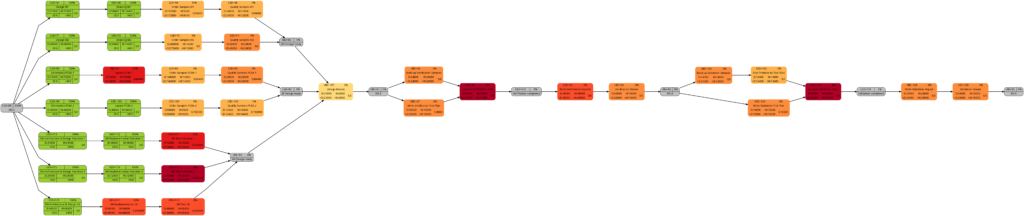
Example 8 was already mentioned in the blog post Colored Network Diagrams (Part 1). It is a fictious simplified project plan with development, verification, and validation activities where some tasks have already been completed. The green vertical line in the plan shows the status date.

Tasks that have been completed 100% are colored in green color across all network graphs indicating that these tasks do not require any more attention in the remaining project. While the network graphs had already been shown in the blog post Colored Network Diagrams (Part 1), they shall nevertheless ben shown again as the new script mysql2dot-v2.sh shows additional information (remaining duration, remaining work) for each task. For completed tasks, those values as well as total task slack are 0, of course.

The new script mysql2dot-v2.sh offers 3 additional graphs (menu choices 5…7):
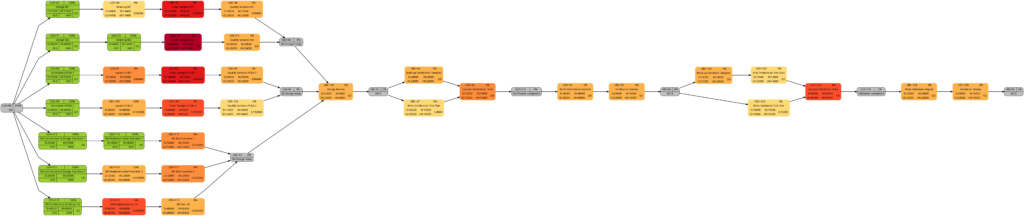
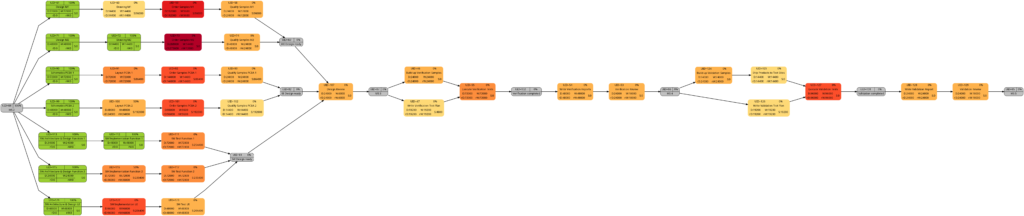
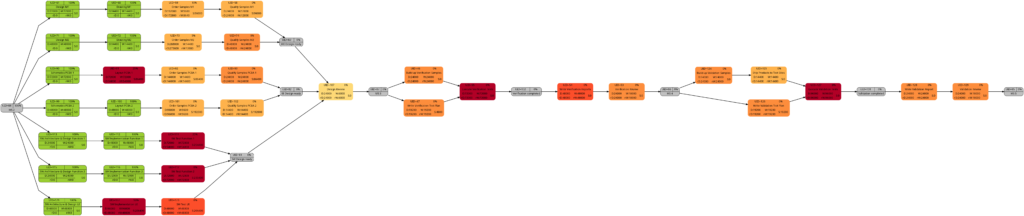
Let us have a closer look at these graphs and compare some of them:
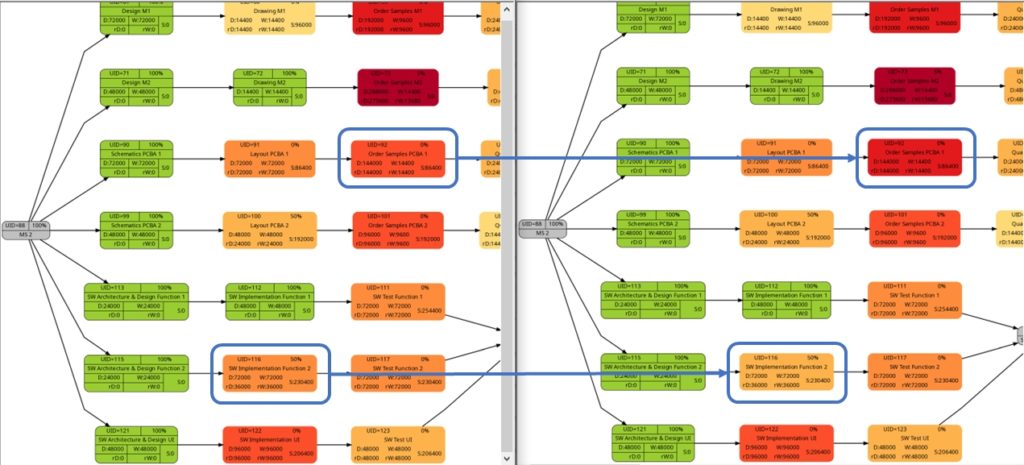
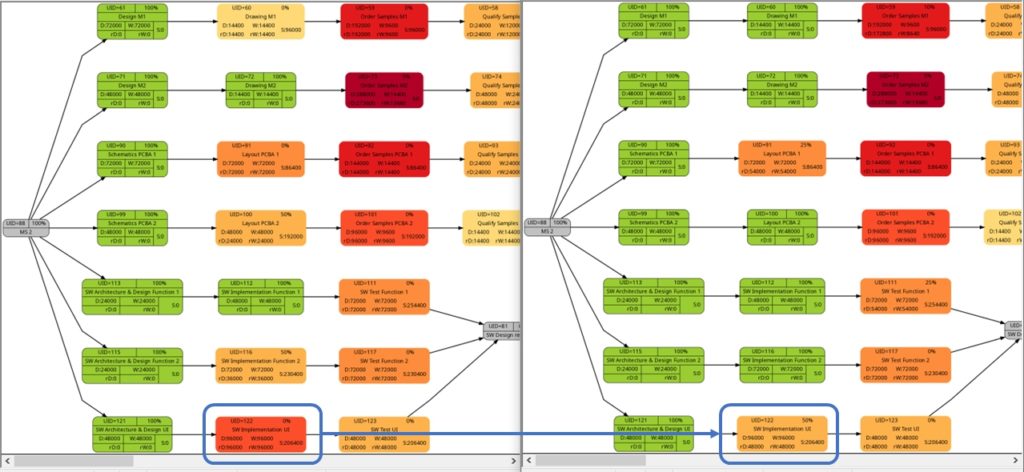
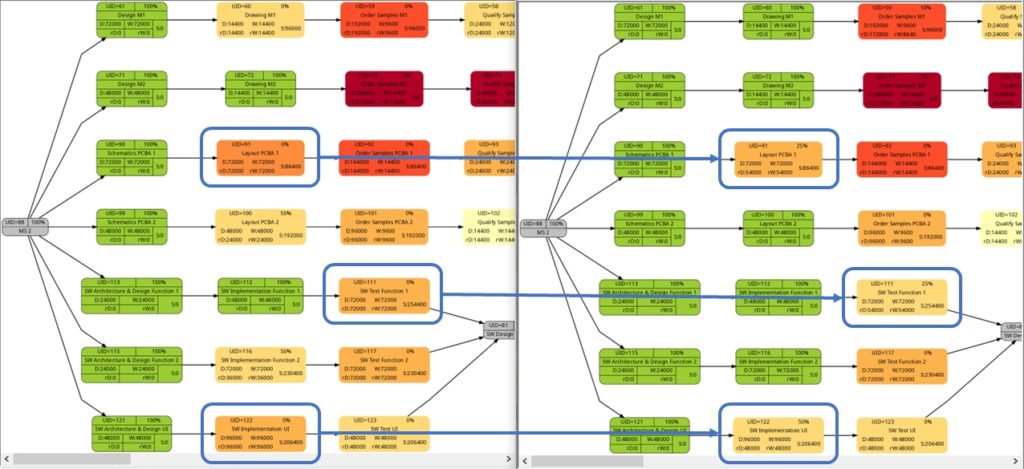
The comparison of the graphs above show two tasks whose colors have changed in different directions of color shades:
- The task with UID=116 changes to a lighter color shade. This is because the left graph takes the duration into account (D=72000), and the right graph takes the remaining duration into account (rD=36000). As the remaining duration is less than the duration, we can expect that change in the color shade.
- The task with UID=92 changes to a darker color shade although the values for the duration (D=14400) and the remaining duration (rD=14400) are equal. Why is that?
The explanation is that the spread between the color shades (the variable ${color_step} in the script mysql2dot-v2.sh) is computed based on the maximum remaining duration in the graph on the right side, different from the maximum duration in the graph on the left side. Consequently, if there is a task with a very long duration in the left graph and this task has a significantly lower remaining duration, this might occur in a smaller spread (a smaller value of ${color_step}) when the network graph for the remaining duration is computed.
I am personally open to the discussion of whether a different spread as seen in example (2) makes sense or not. For the moment, I decided to proceed like that. But there are valid arguments for both approaches:
- Leaving the spread equal between both graphs makes them directly comparable 1:1. This might be important for users who regularly compare the network graph colored according to task duration with the one colored according to remaining task duration.
- Computing the spread from scratch for each graph sets a clear focus on the tasks which should be observed now because they have a long remaining duration, irrespective of whether the tasks once in the past had a longer or shorter duration.
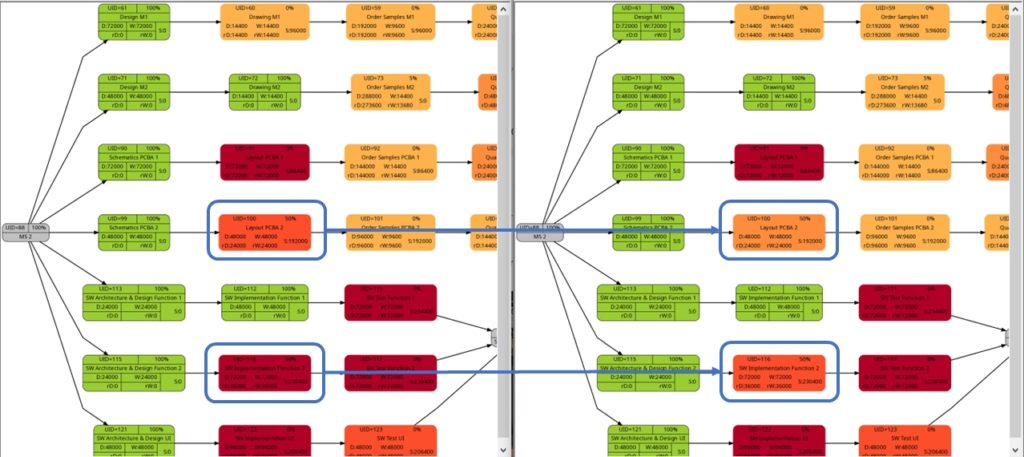
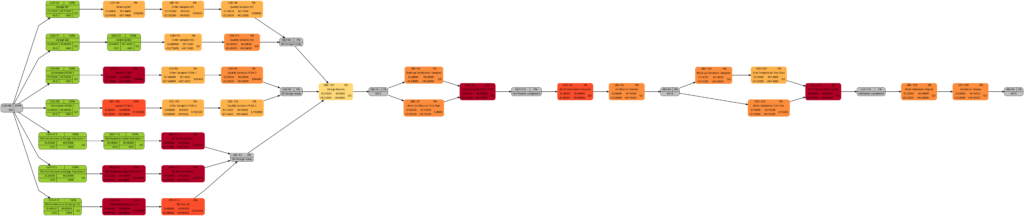
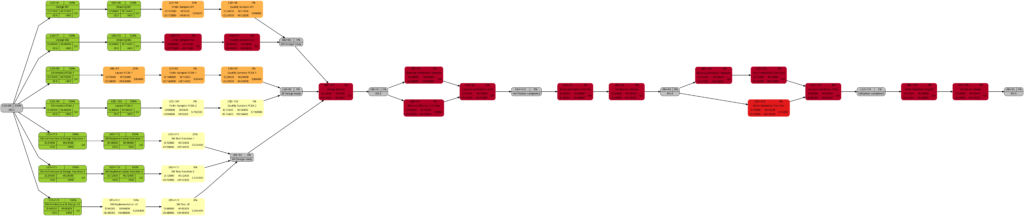
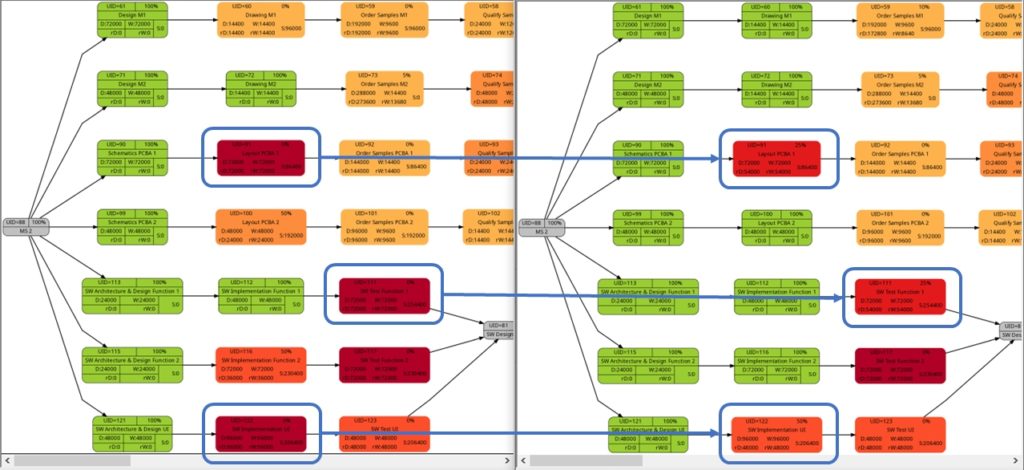
The shift of color shades in the graph above seems logical and corresponds to the case (1) of the previous example. For both the tasks with UID=100 and UID=116, the value of the remaining task work is half the value of the task work, and therefore, in the network graph for the remaining task work, both tasks feature lighter color shades as they are “less problematic”.
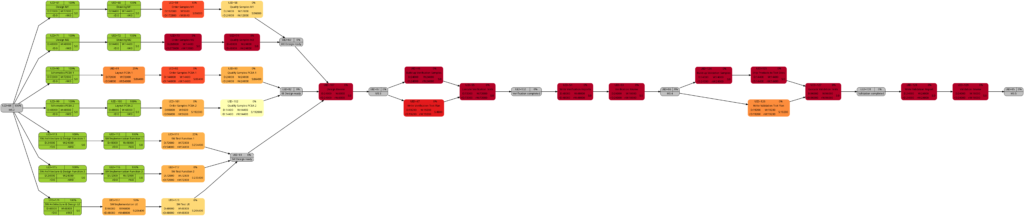
As already explained in the blog post Colored Network Diagrams (Part 1), criticality is computed based on the information of task slack and task duration. Whereas the script mysql2dot.sh used the task finish slack for this calculations, I decided to change to task total slack in the newer script mysql2dot-v2.sh; that seemed to be more adequate although in my examples, both values have been the same for all involved tasks.
In both versions of the scripts, logarithmic calculations are undertaken, and their outcome is different from the calculations based on the square root for the network graphs according to (remaining) task durations. As a result, we only observe a color shift in the task with UID=116. As the remaining task duration is half of the task duration, this task is less critical (hence, a lighter color shade) on the right side of the image above.
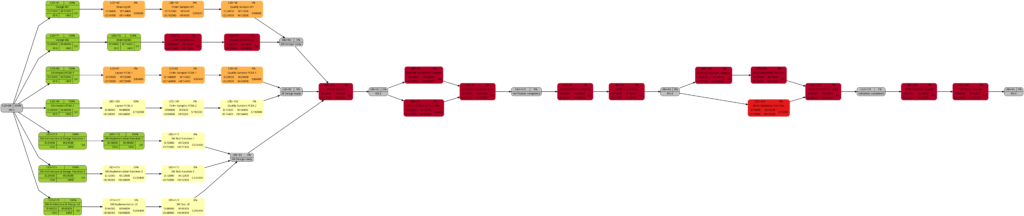
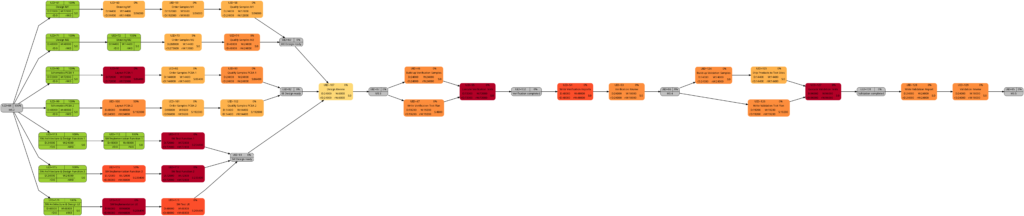
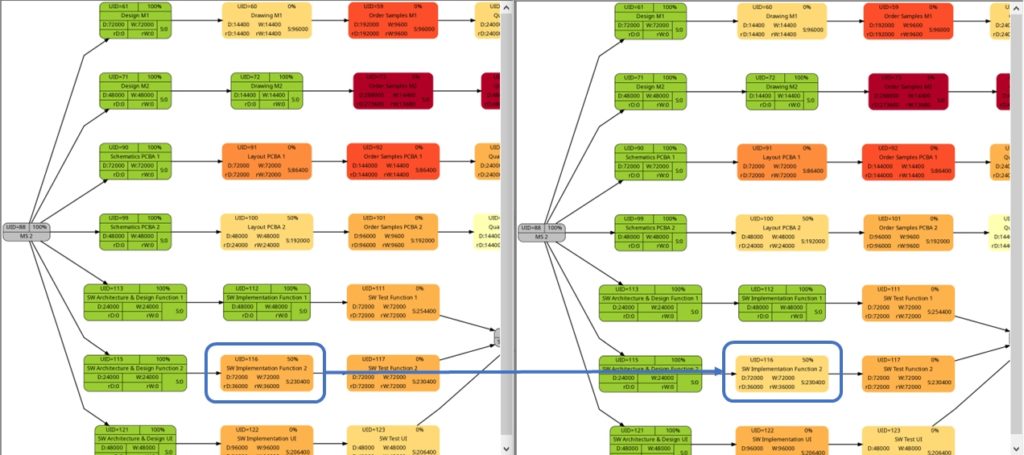
Example 9: Same project plan (more in the future)
Jumping to the future, more tasks of the same project plan have been completed either entirely or partially. Again, the green vertical line in the plan shows the status date.
The resulting graphs are:
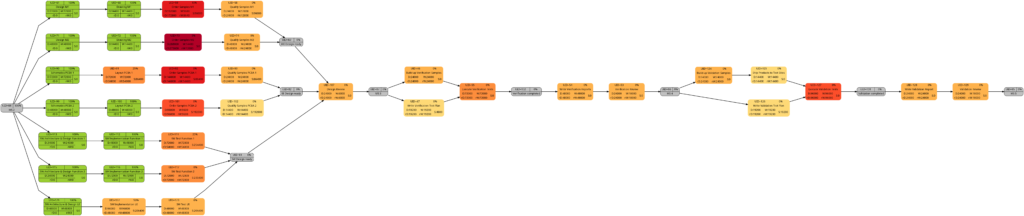
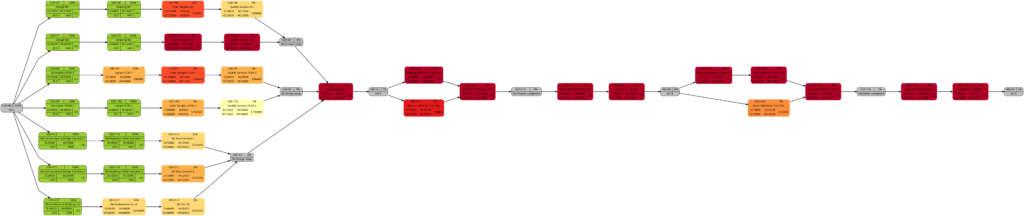
We will now look at some of the graphs and compare them with the equivalent graphs in Example 8. Apart from tasks being colored in green color once they have been completed, there are only differences in color shades of tasks belonging to the network graphs of:
- remaining task duration
- remaining task work
- remaining task criticality
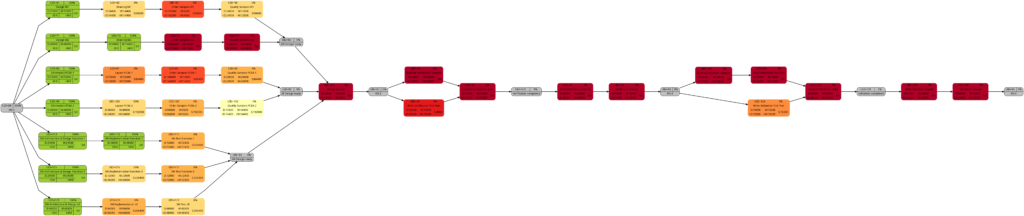
as completed tasks have their remaining values set to 0 and therefore diminish the set of tasks that are considered for the calculation. In contrast to this, there are no changes in the network graphs of:
- task duration
- task work
as the respective values do not change for completed tasks. We could, however, in theory experience changes in the network graphs of:
- task slack
- task criticality
as complete tasks have their slack values set to 0 and therefore diminish the set of tasks that are considered for the calculation. This was not the case in our examples, though. It should also be mentioned that there might be changes in the color shade for a task where the duration or work is increased due to a revised assessment of the project manager from one status date to the other.
As mentioned above, the changes in the color shade of the highlighted tasks in the comparisons above are due to the fact that either the remaining duration or the remaining work of the respective tasks change between the earlier and the later status date.
Conclusion
The scripts create_project_db-v2.sql, msp2mysql-v2.sh and mysql2dot-v2.sh and the examples provided above show how, using the powerful graphviz package, traditional project plans created with Microsoft® Project can be visualized in a set of graphs that can help a project manager to focus on the right tasks. Compared to the set of scripts in the blog post Colored Network Diagrams (Part 1), the improved set of scripts additionally allow the examination of the task duration, task value, and task criticality based on remaining values of the tasks, and so can answer the question “How does the project look now?” more adequately.
Outlook
In the near future, I plan to rewrite the script mysql2dot-v2.sh into PHP because I want to incorporate an algorithm which I developed back in 2010 that can show the first x critical paths of the project using a recursive PHP function and several large multi-dimensional arrays.
Sources
Files
- create_project_db-v2.sql sets up the database in MySQL or MariaDB. The script works with the user gabriel who assumes to have access to the database server without password; you might have to adapt the script to your environment and needs.
- msp2mysql-v2.sh reads a Microsoft® Project plan in XML, parses it and writes the data into the MariaDB database.
- mysql2dot-v2.sh reads from the MariaDB database and creates a script for dot, a tool of the graphviz suite.
- Example_8-v2.zip contains all files with respect to Example 8 (created with the current set of scripts).
- Example_9-v2.zip contains all files with respect to Example 9.
Disclaimer
- The program code and the examples are for demonstration purposes only.
- The program code shall not be used in production environments without further modifications.
- The program code has not been optimized for speed (It’s a bash script anyway, so do not expect miracles.).
- The program code has not been written with cybersecurity aspects in mind.
- While the program code has been tested, it might still contain errors.
- Only a subset of all possibilities in [1] has been used, and the code does not claim to adhere completely to [1].