Delay Propagation in a Parallel Task Chain
Problem Statement
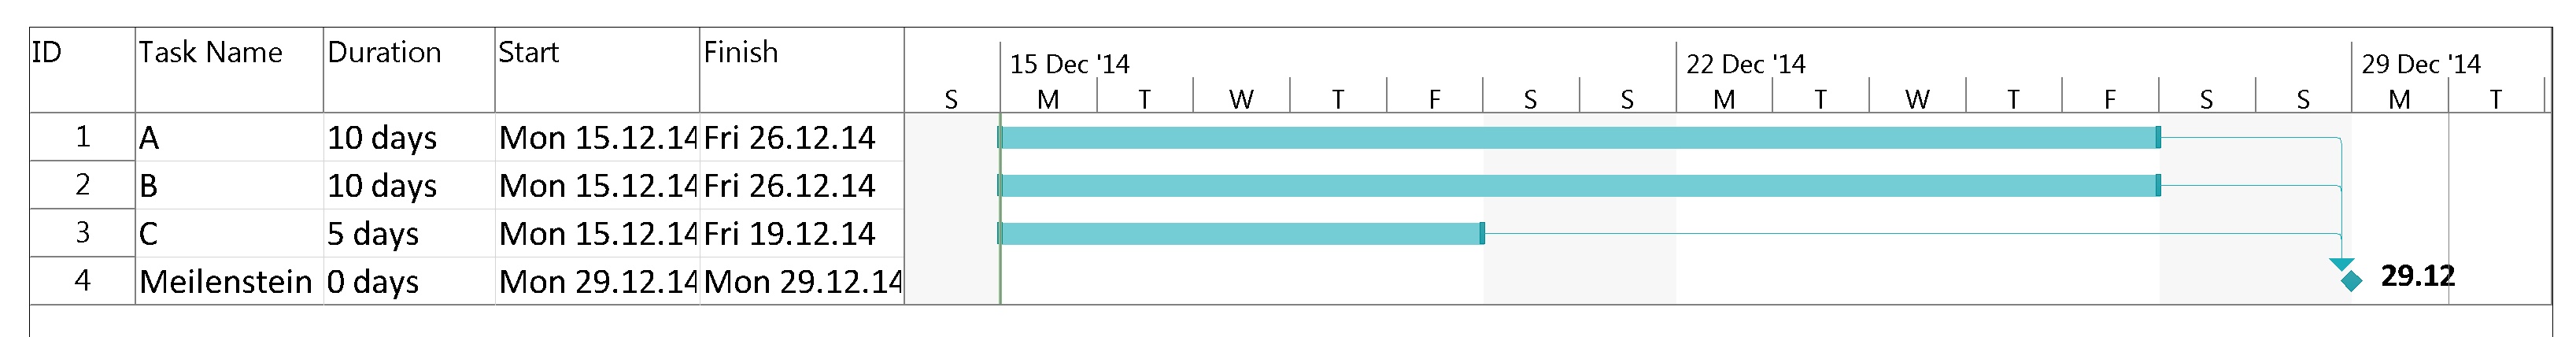
Similar to the last blog, we now want to examine how delays in parallel tasks propagate if we have a discrete and non-binary probabilistic pattern of delay for each involved task. We will assume to have reached our milestone if each task has been completed. We take the same example tasks as yesterday, but now, they are in parallel:
Source Data
In our example, we have 3 tasks, named “A”, “B” and “C”, and their respective durations is distributed according to the table and the graph below:
| Duration | 0 d | 1 d | 2 d | 3 d | 4 d | 5 d | 6 d | 7 d | 8 d | 9 d | 10 d | 11 d | 12 d | 13 d | 14 d | 15 d | 16 d | 17 d | 18 d | 19 d | 20 d | |
| A | 0% | 0% | 0% | 0% | 0% | 0% | 0% | 0% | 0% | 0% | 0% | 5% | 10% | 25% | 20% | 15% | 10% | 10% | 5% | 0% | 0% | 100% |
| B | 0% | 0% | 0% | 0% | 0% | 0% | 0% | 0% | 0% | 0% | 40% | 30% | 20% | 10% | 0% | 0% | 0% | 0% | 0% | 0% | 0% | 100% |
| C | 0% | 0% | 0% | 0% | 0% | 0% | 50% | 50% | 0% | 0% | 0% | 0% | 0% | 0% | 0% | 0% | 0% | 0% | 0% | 0% | 0% | 100% |
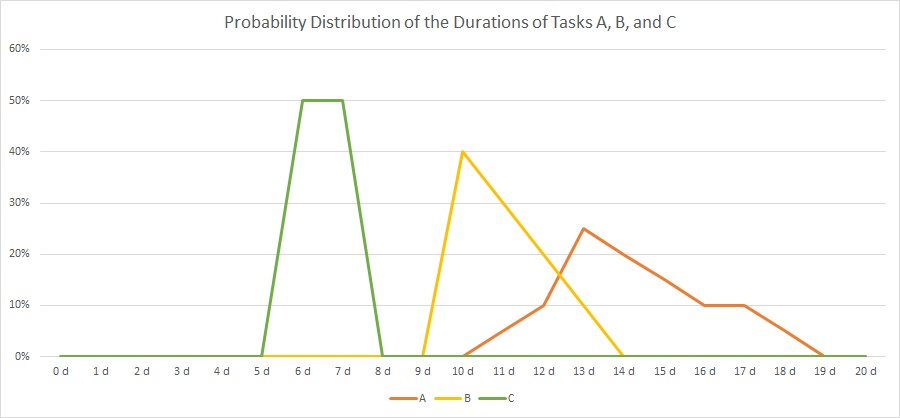 As you can see, there is not a fixed duration for each task as we have that in traditional project management. Rather than that, there are several possible outcomes for each task with respect to the real duration, and the probability of the outcome is distributed as in the graph above. The area below each graph will sum up to 1 (100%) for each task.
If we assume these distributions, how does the probability distribution of our milestone outcome look like?
Solution
If we consider our milestone to be reached when all tasks have been completed, that is, when A, B, and C have been completed, then it becomes obvious that the distribition of task C has no influence at all. Even after 8 days when C has been completed with 100% certainty, there is no chance that either A or B will have started ever. The earliest day when our milestone could happen is on day 11 because this is the first day when there is a slight chance that A could be completed.
On the other side, on day 19, all tasks have been completed with 100% certainty, and hence by then, the milestone will have been reached for sure.
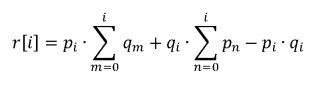
The correct mathematical approach in order to compute the resulting distribution is, for 2 tasks:
In order to facilitate our work and enable us to compute many parallel tasks, we use a C program named parallel.c which processes an input file of probability distributions in a certain format:
- Each description of a probability distribution of a task begins with a statement named # START
- Each description of a probability distribution of a task ends with a statement named # STOP
- Lines with comments must start with a #
- Empty lines are ignored.
- Data lines have an integer value, at least one white space and then a probability. This format can also be used for visualizations with gnuplot.
- The sum of probabilities for each task must add up to 1.00 (= 100%).
- Probability distributions for several tasks can be combined in one input file.
- The output file which the C file parallel.c will generate has the same syntax and can therefore be used as input file for further calculations.
The program parallel.c will compute 2 input vectors at a time and then use the result cor computation with the third, fourth, etc. input vector.
In the example, we use the input:
# START
11 0.05
12 0.10
13 0.25
14 0.20
15 0.15
16 0.10
17 0.10
18 0.05
# STOP
10 0.40
11 0.30
12 0.20
13 0.10
# STOP
6 0.50
7 0.50
# STOP
# The resulting vector is of size: 19
# START
0 0.0000
1 0.0000
2 0.0000
3 0.0000
4 0.0000
5 0.0000
6 0.0000
7 0.0000
8 0.0000
9 0.0000
10 0.0000
11 0.0350
12 0.1000
13 0.2650
14 0.2000
15 0.1500
16 0.1000
17 0.1000
18 0.0500
# STOP
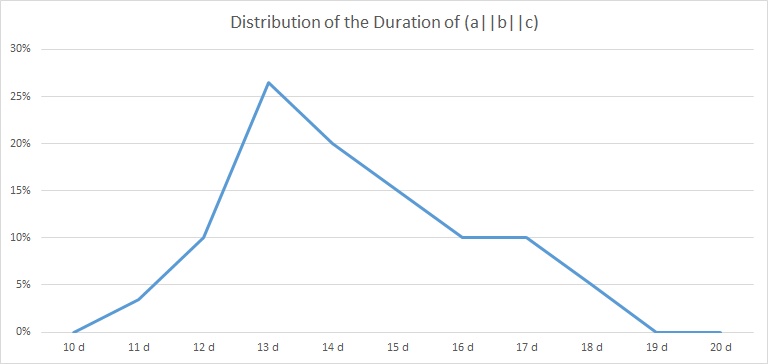
which is shown in the table and the graph below:
| Duration | 10 d | 11 d | 12 d | 13 d | 14 d | 15 d | 16 d | 17 d | 18 d | 19 d | 20 d | |
| (a||b||c) | 0,00% | 3,50% | 10,00% | 26,50% | 20,00% | 15,00% | 10,00% | 10,00% | 5,00% | 0,00% | 0,00% | 100% |
Downloads and Hints
- You can download the source code of parallel.c from https://caipirinha.spdns.org/~gabriel/Blog/parallel.c. The source code is in Unix format, hence no CR/LF, but only LF. It can be compiled with gcc -o {target_name} parallel.c. The C program is a demonstration only; no responsibility is assumed for damages resulting from its usage. It contains, however, already an optimization for the computational effort.
- The sample input file is available at https://caipirinha.spdns.org/~gabriel/Blog/input_parallel.dat and can be read with a standard text editor. If is also in Unix format (only LF).
- The maximum length of the output vector is of size 100.